Concrete Service Life Prediction

How long will your concrete last, and where should you intervene first?

DIMCOST is software for concrete service life prediction: it turns your inspection and lab data into a prediction of the remaining service life, zone by zone. You plan maintenance based on risk instead of gut feeling, and avoid costly renovation of zones that will last for years.

Sound familiar?

  • Scattered data

    Inspection reports, lab PDFs and photos are spread across folders, mailboxes and external parties.

  • Unknown progression

    You see cracks, spalling or rust stains, but don’t know how fast the damage will progress.

  • Hard-to-defend budgets

    You have to justify a maintenance budget without evidence of when each intervention is really needed.

  • Ageing, exposed structures

    Your structure is over 30 years old and exposed to chlorides, seawater, brackish cooling water or CO₂.

How concrete service life prediction works in DIMCOST

Most inspection tools show what a structure looks like today. Concrete service life prediction calculates how it will perform tomorrow. DIMCOST does this in four steps.

Concrete data management in the DIMCOST platform

All your data in one place

Step 1 · Data management

Upload existing inspection reports, lab results, NDT measurements and photos, or import data that you or other parties have already collected.

  • Lab and field data: chlorides, carbonation depth, concrete cover and cores (on-site testing is possible through our sister company BETON+), together with NDT measurements and photos.

  • One auditable digital twin: all information per asset comes together in a single place.

  • Full history: every test, repair and inspection stays traceable over time.

Damage in 3D, in the right place

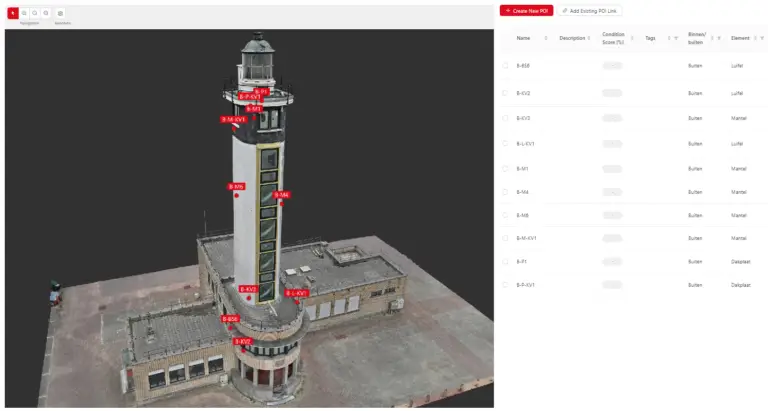
Step 2 · 3D inspection

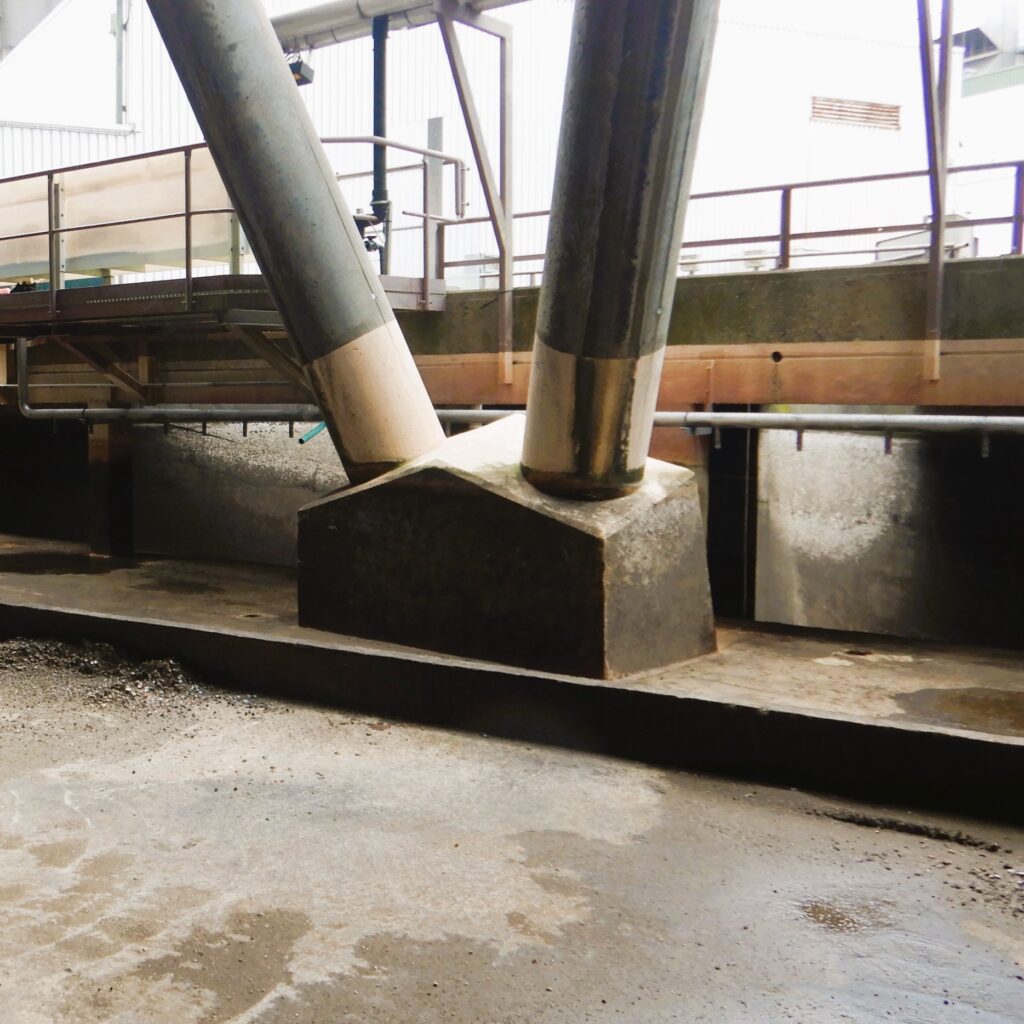
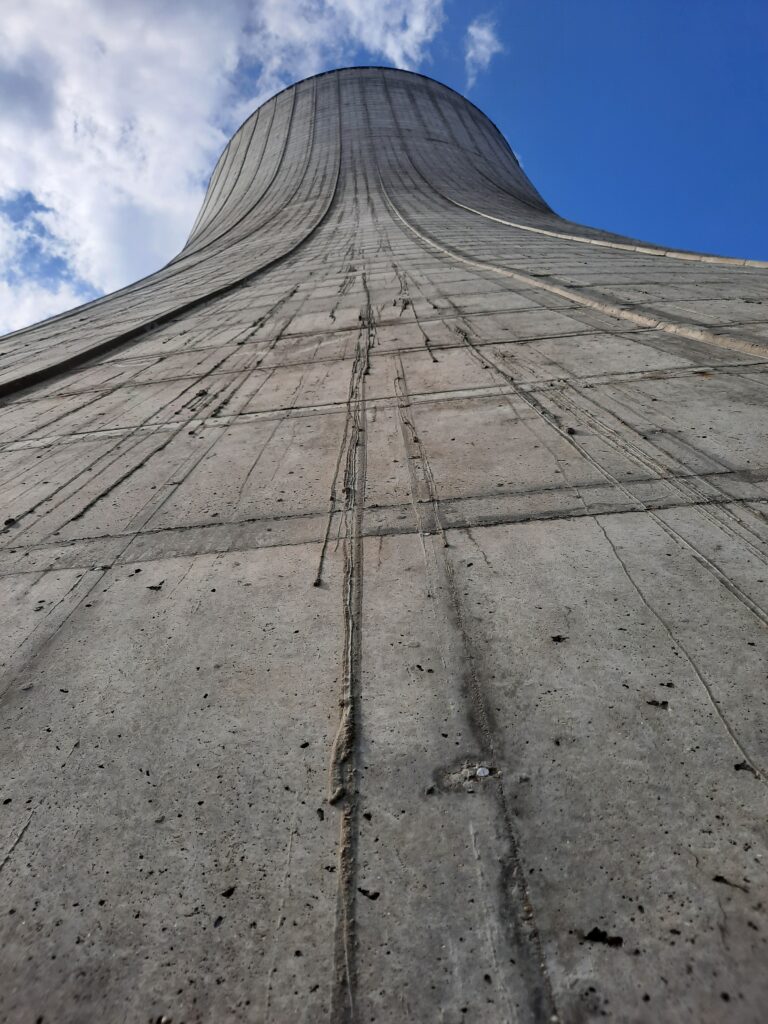
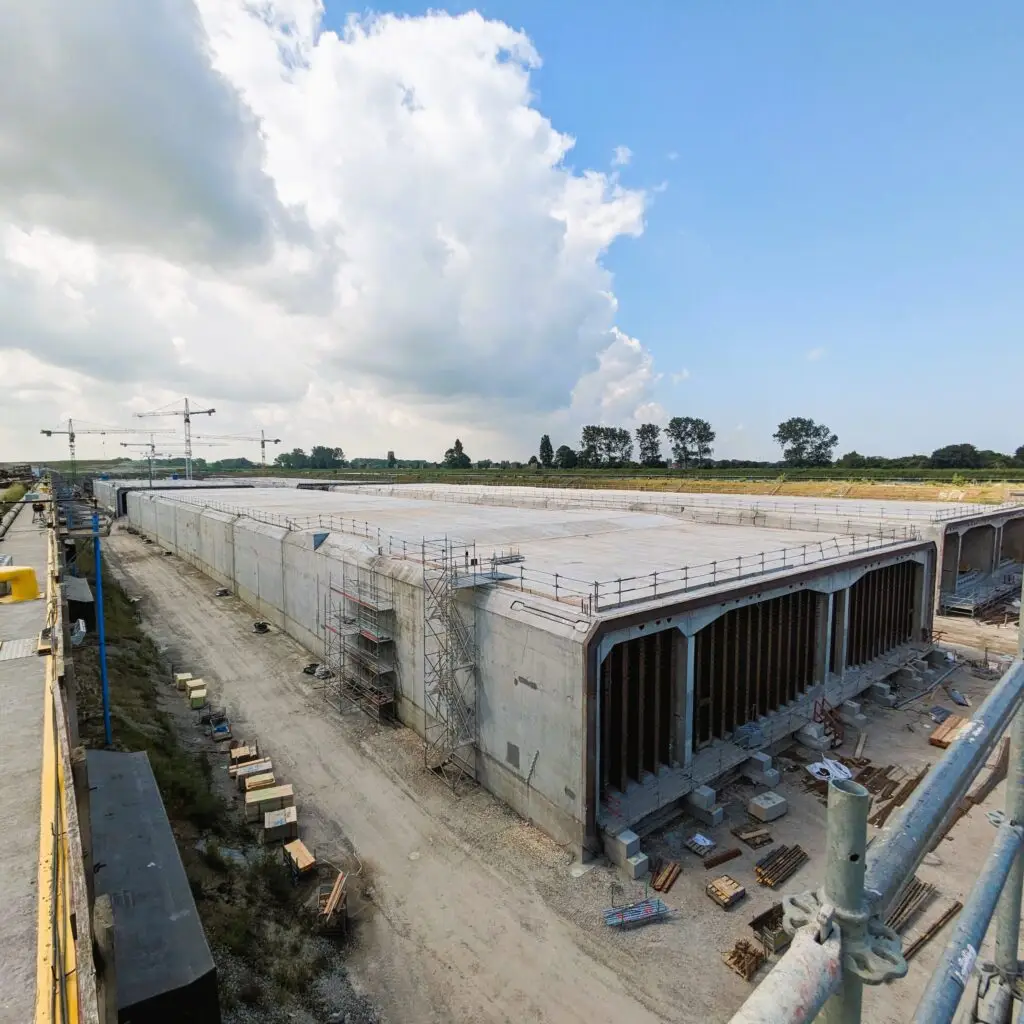
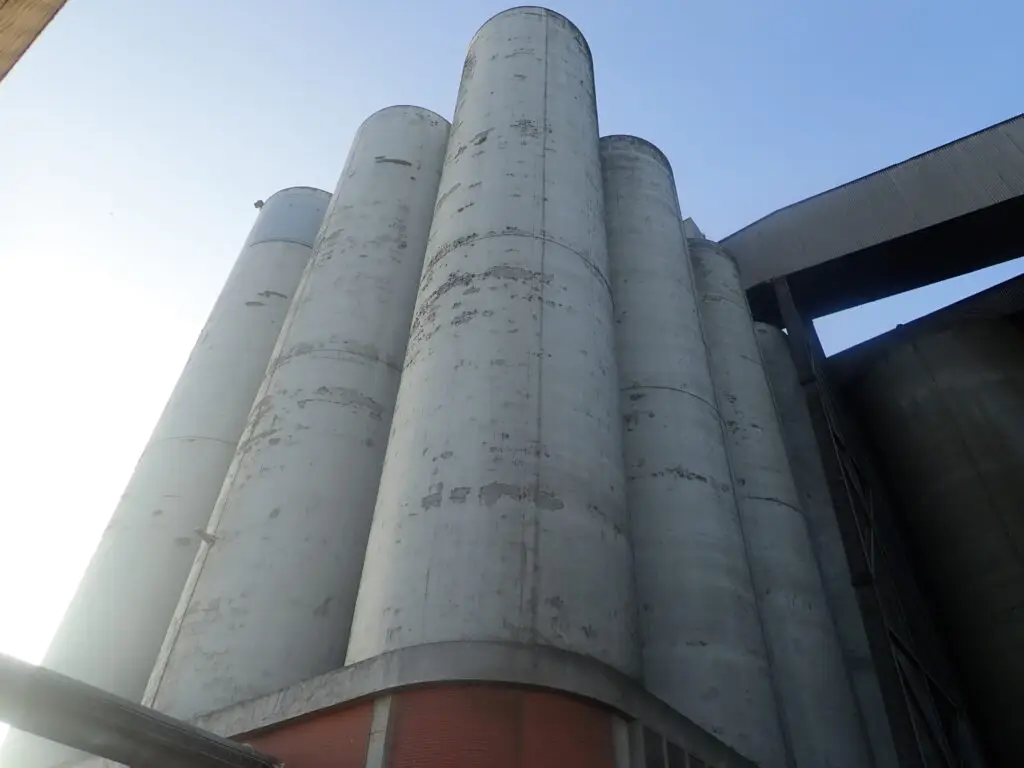
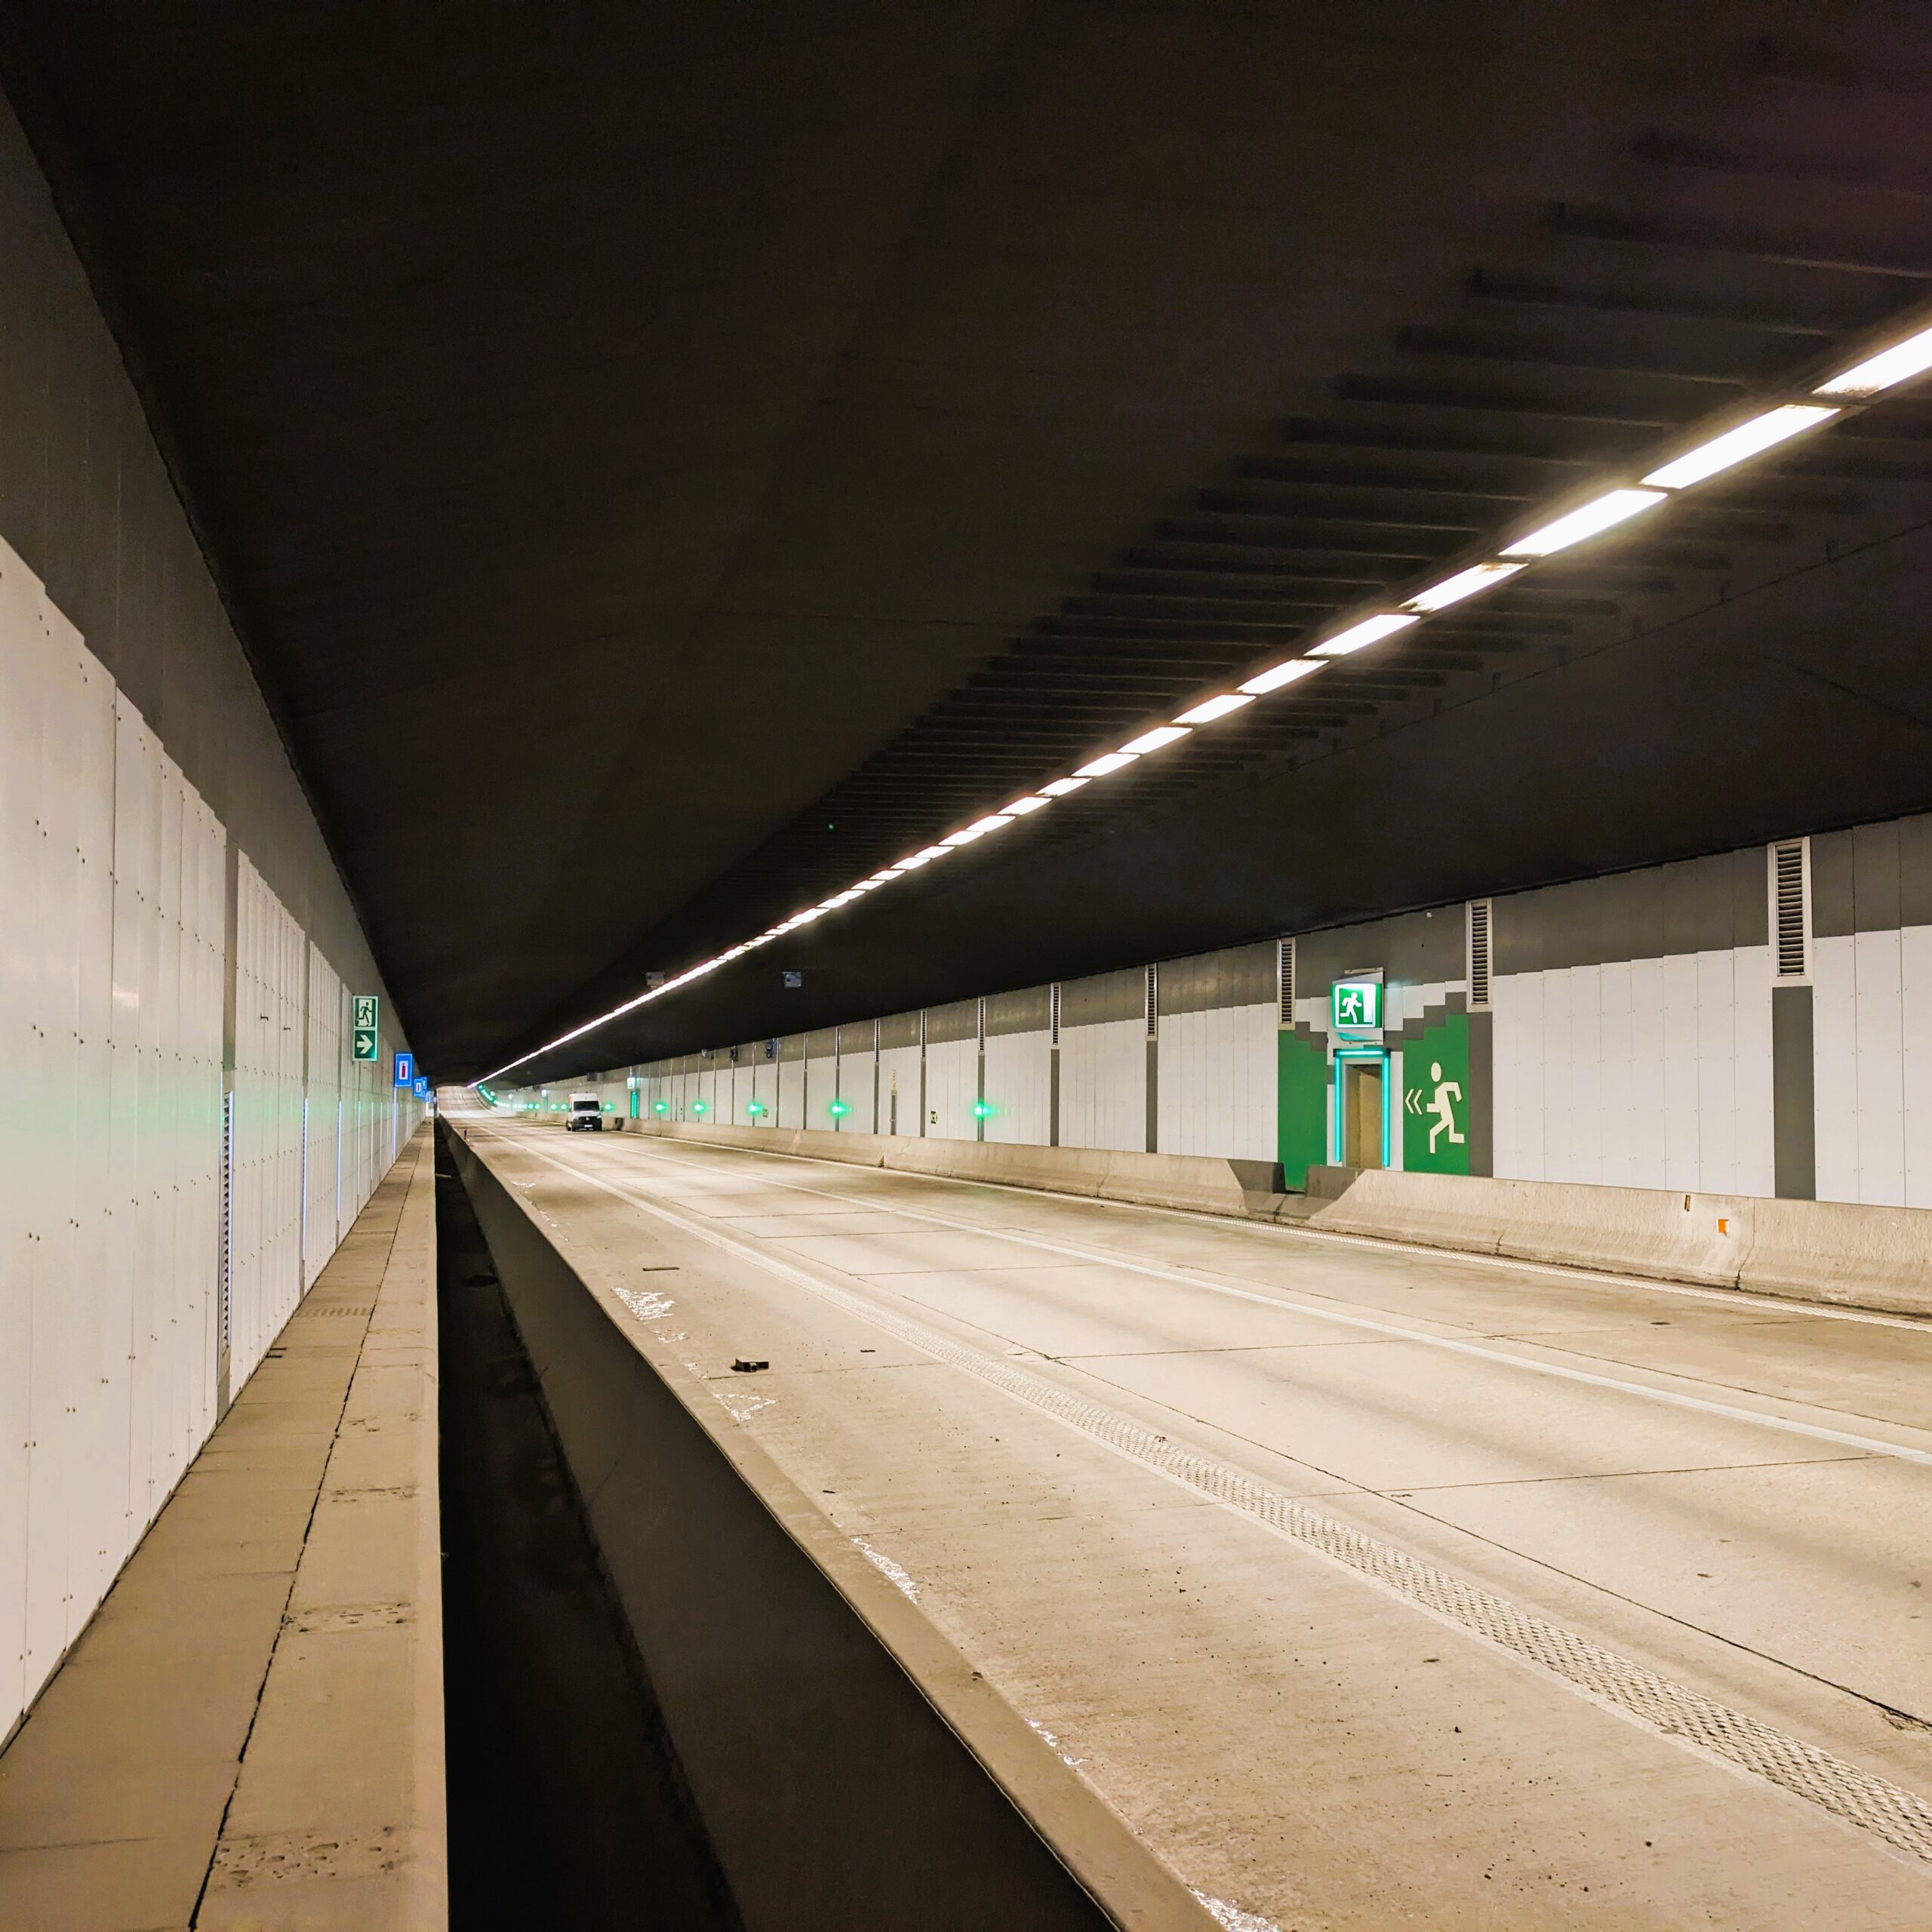
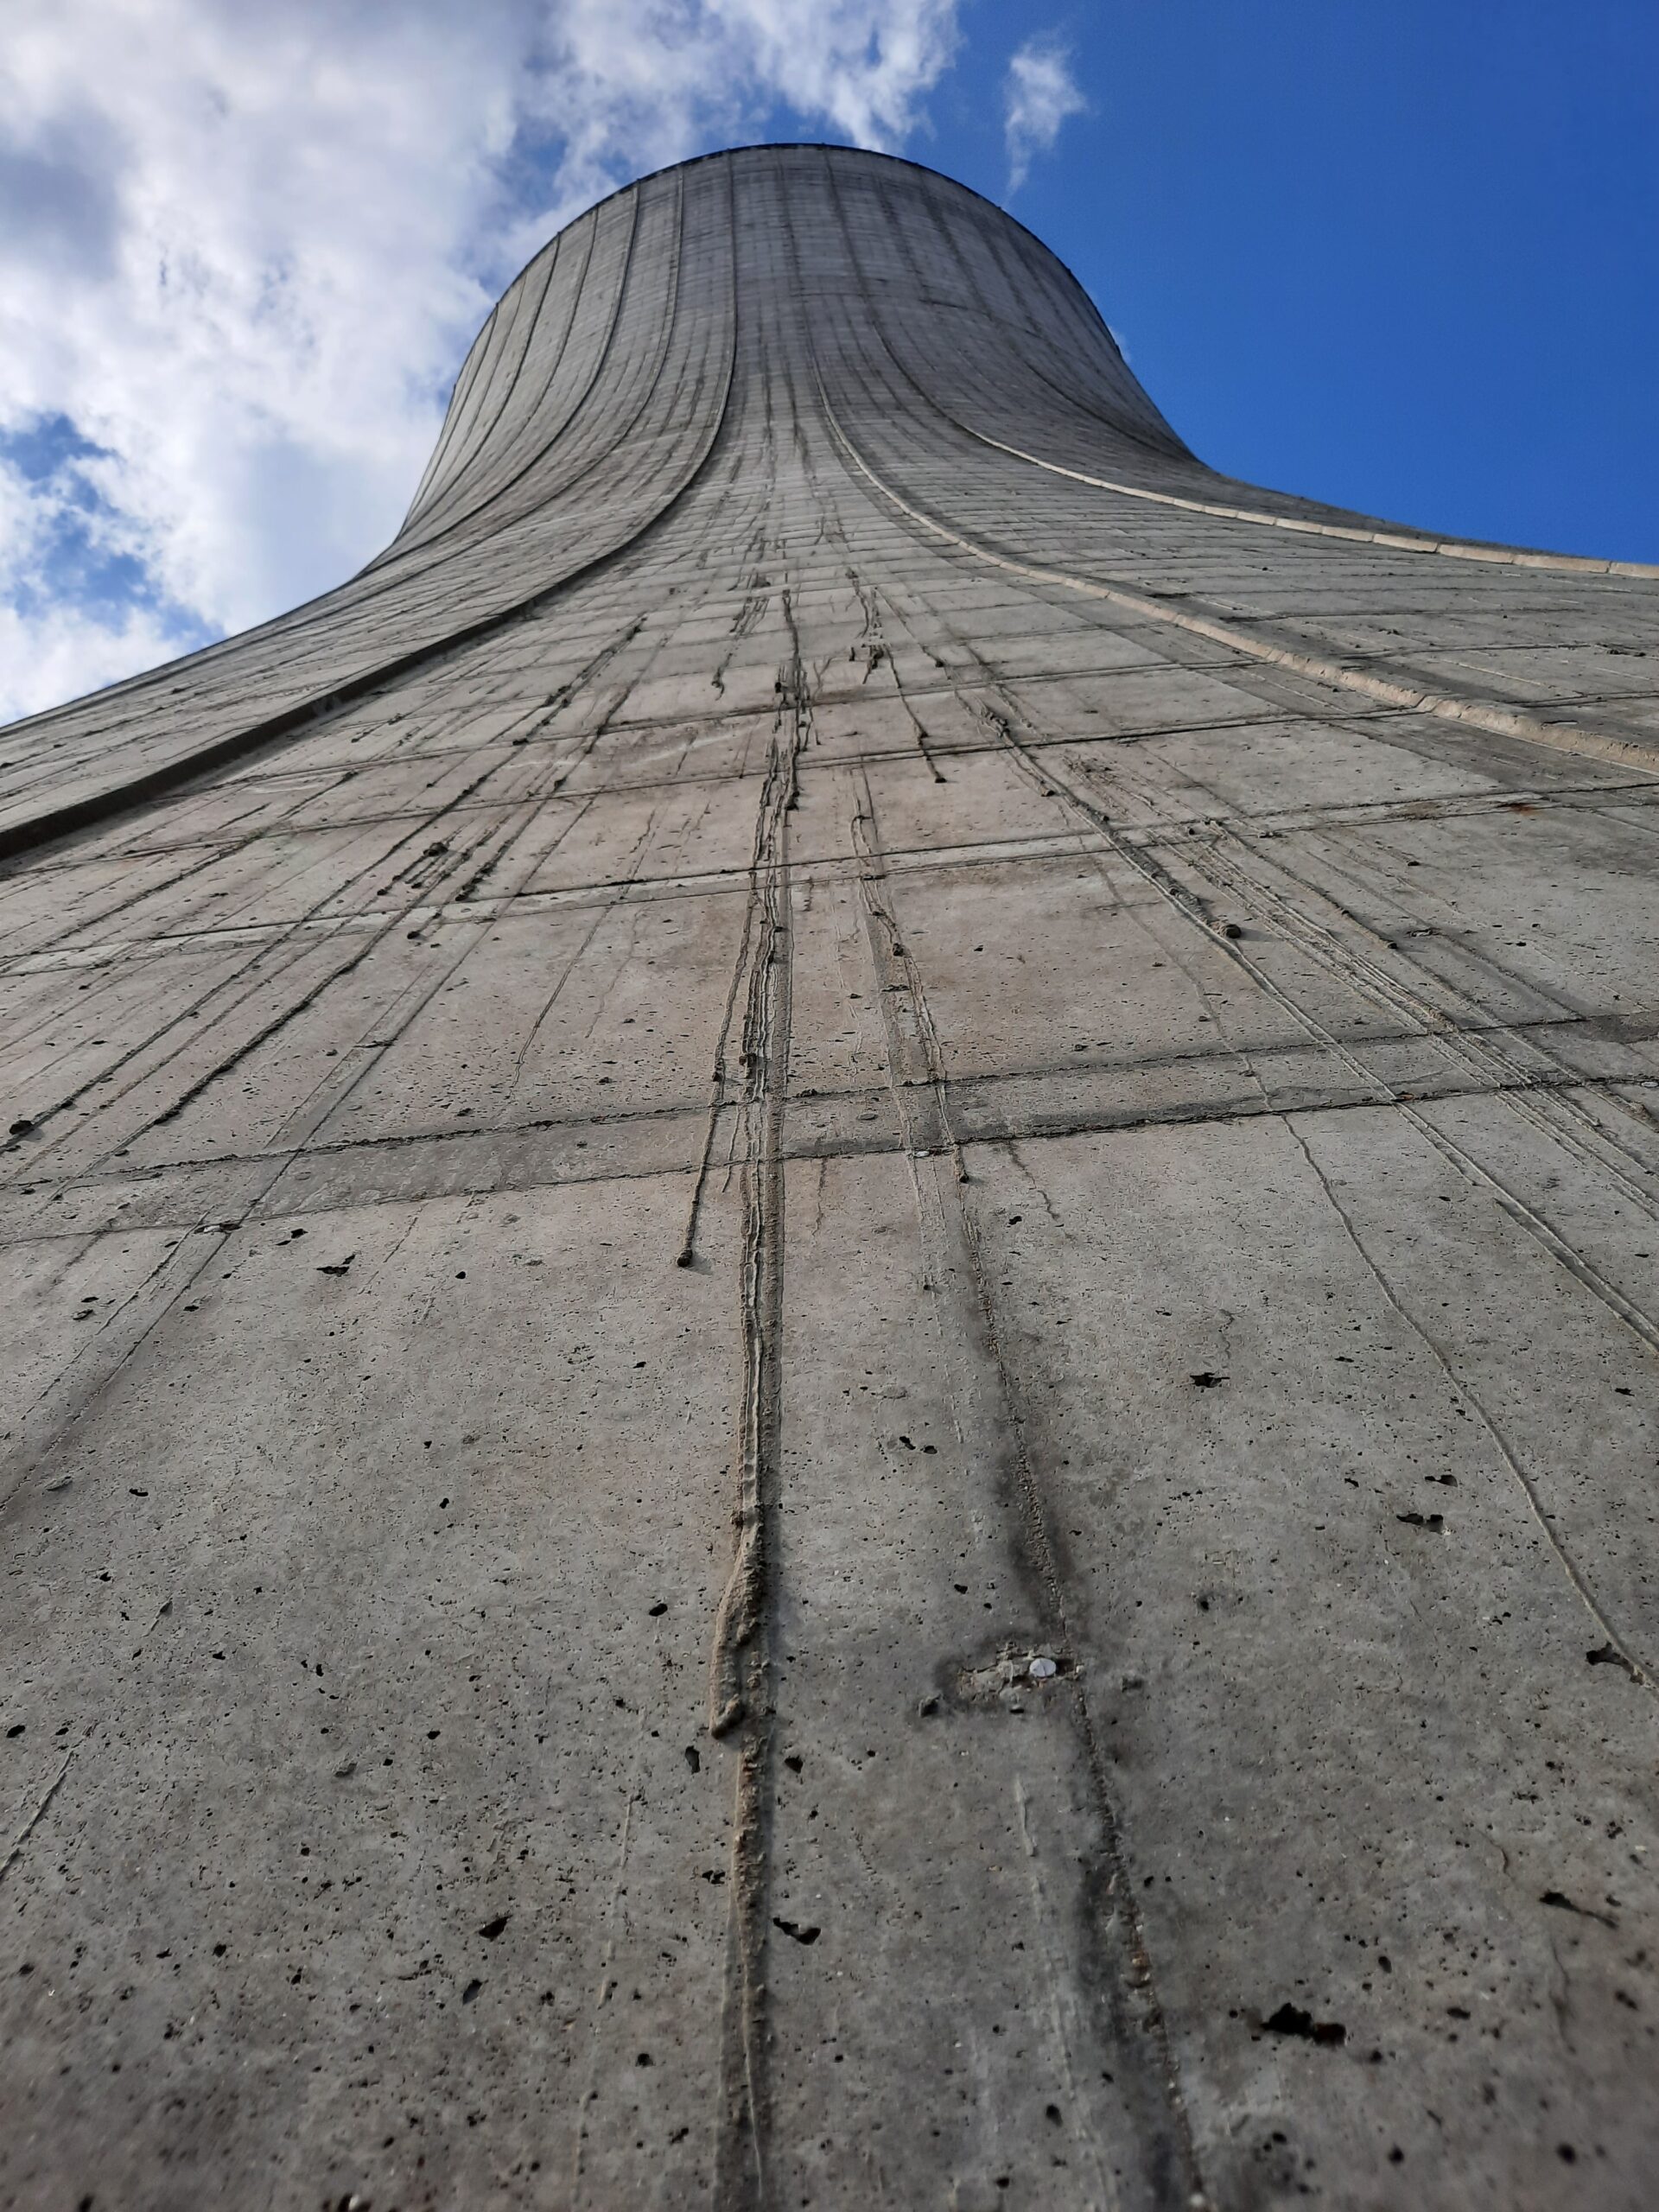
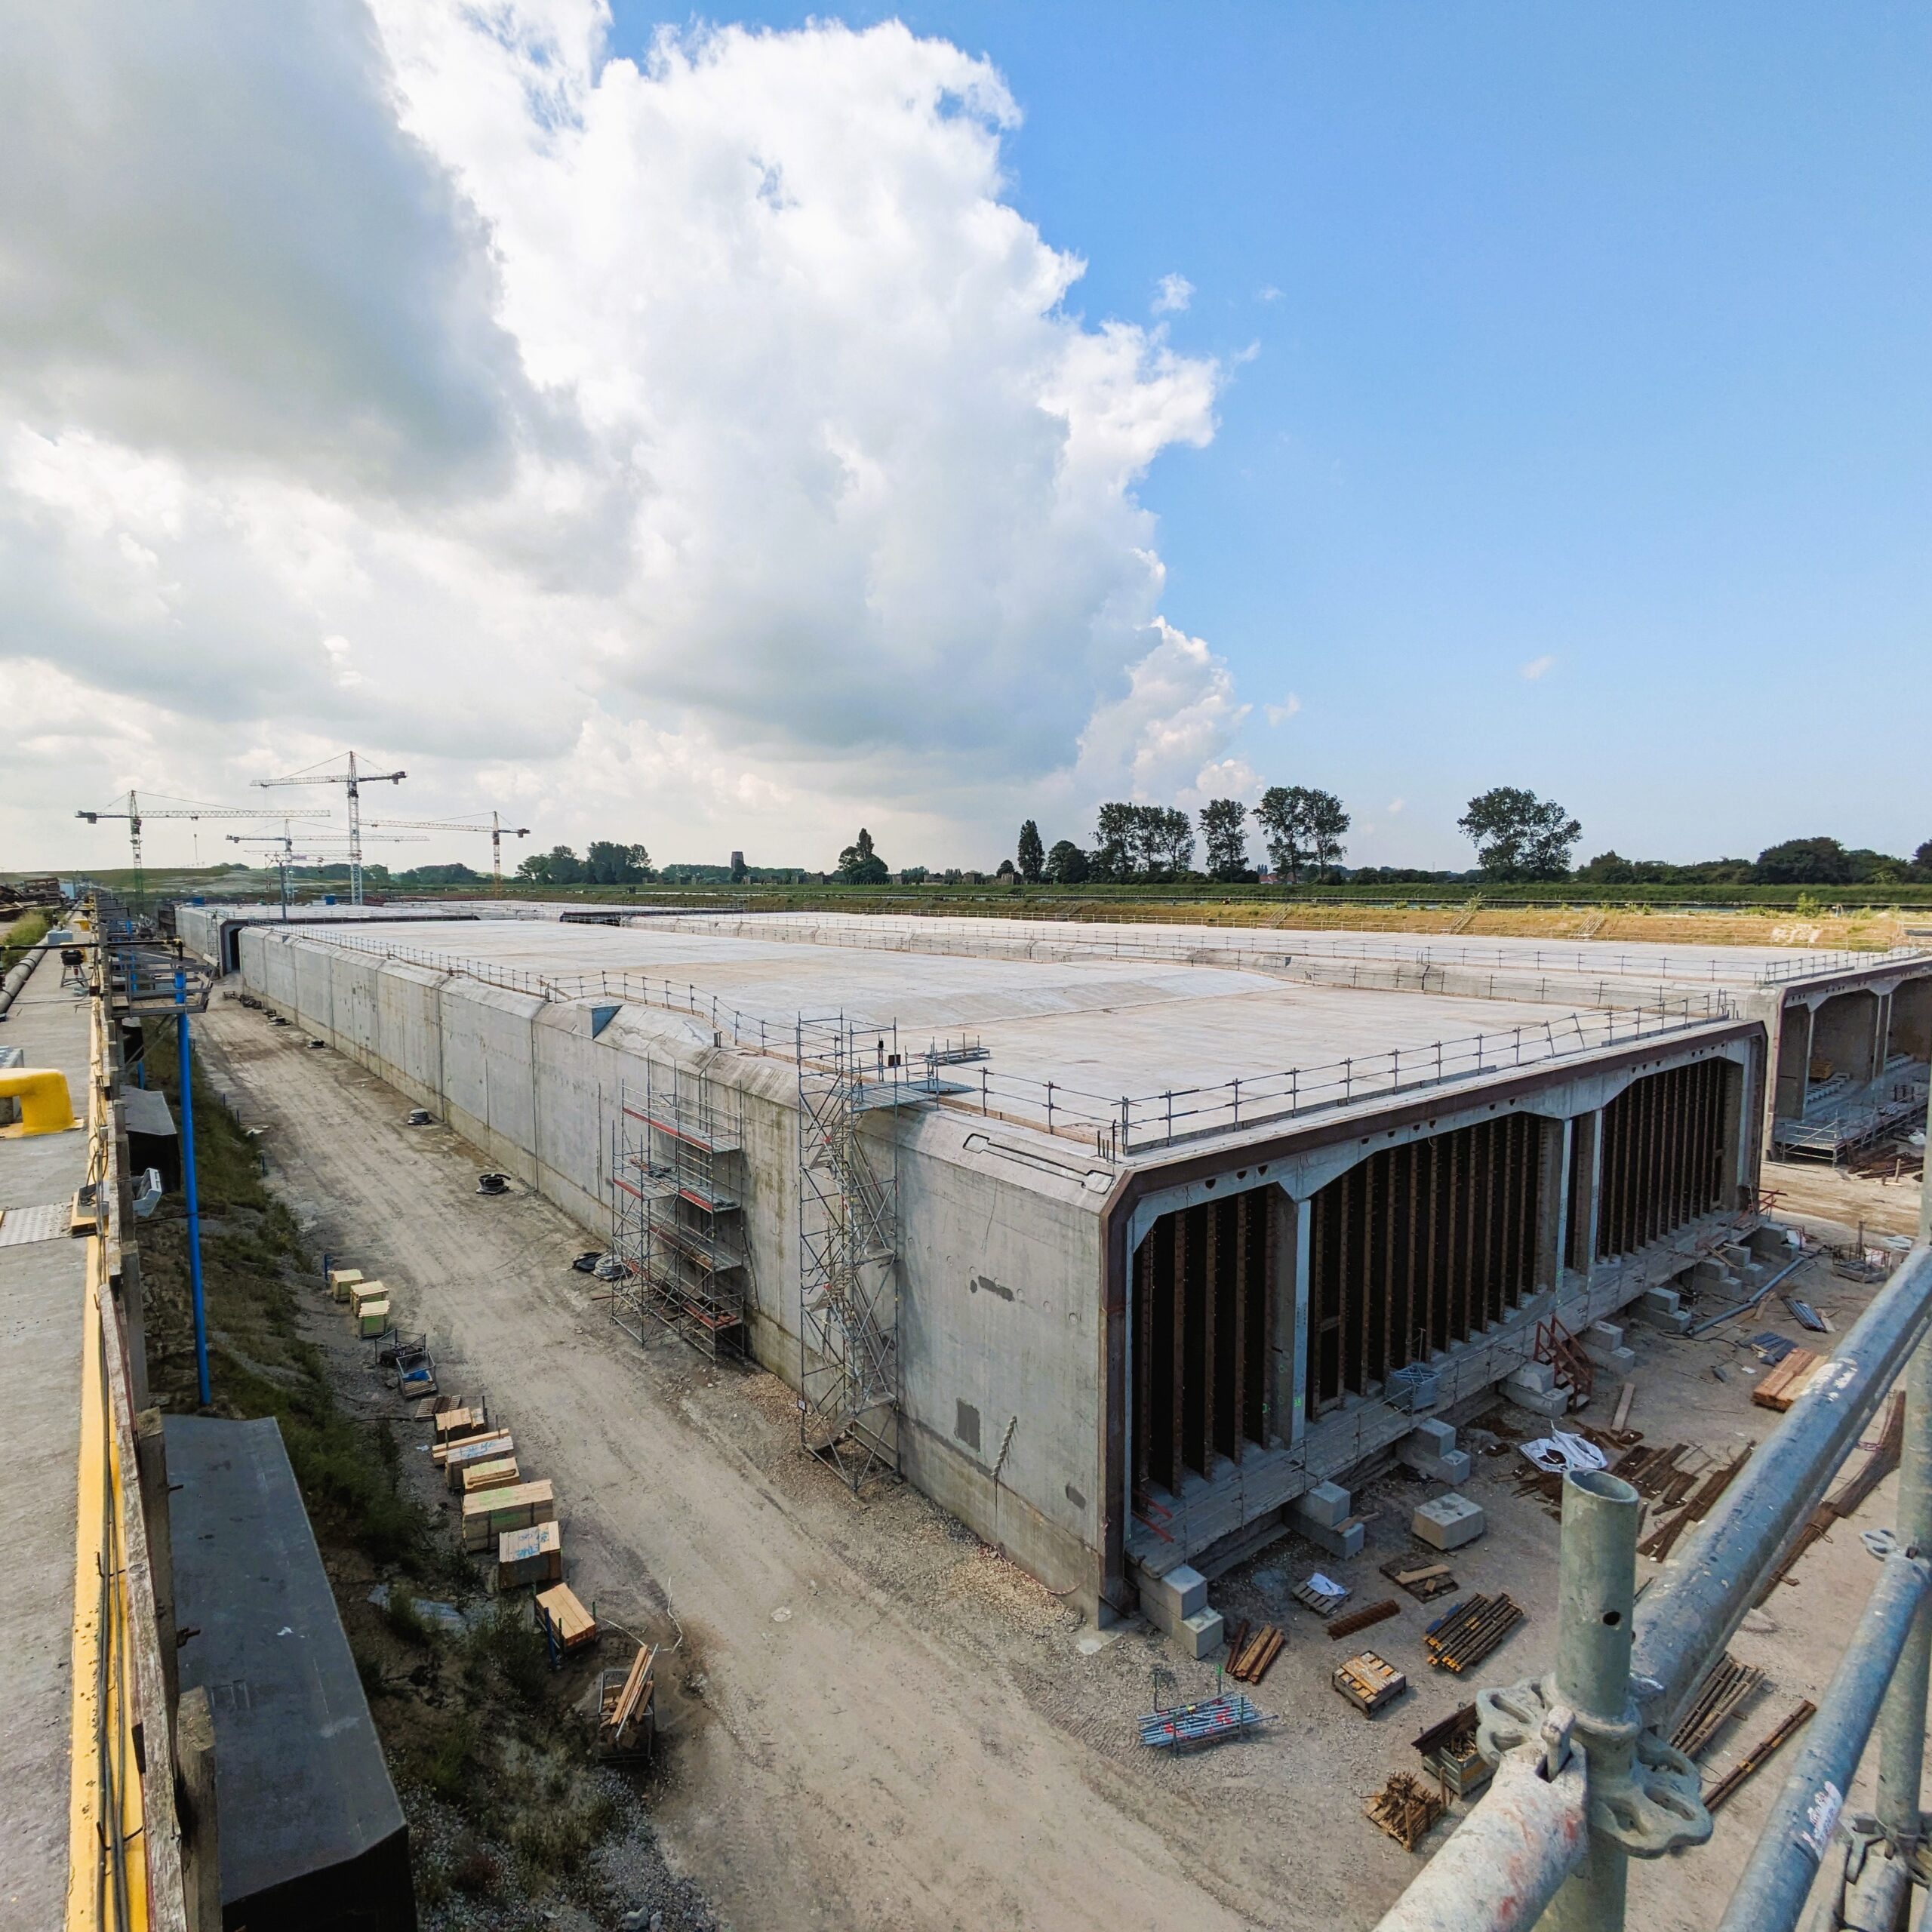
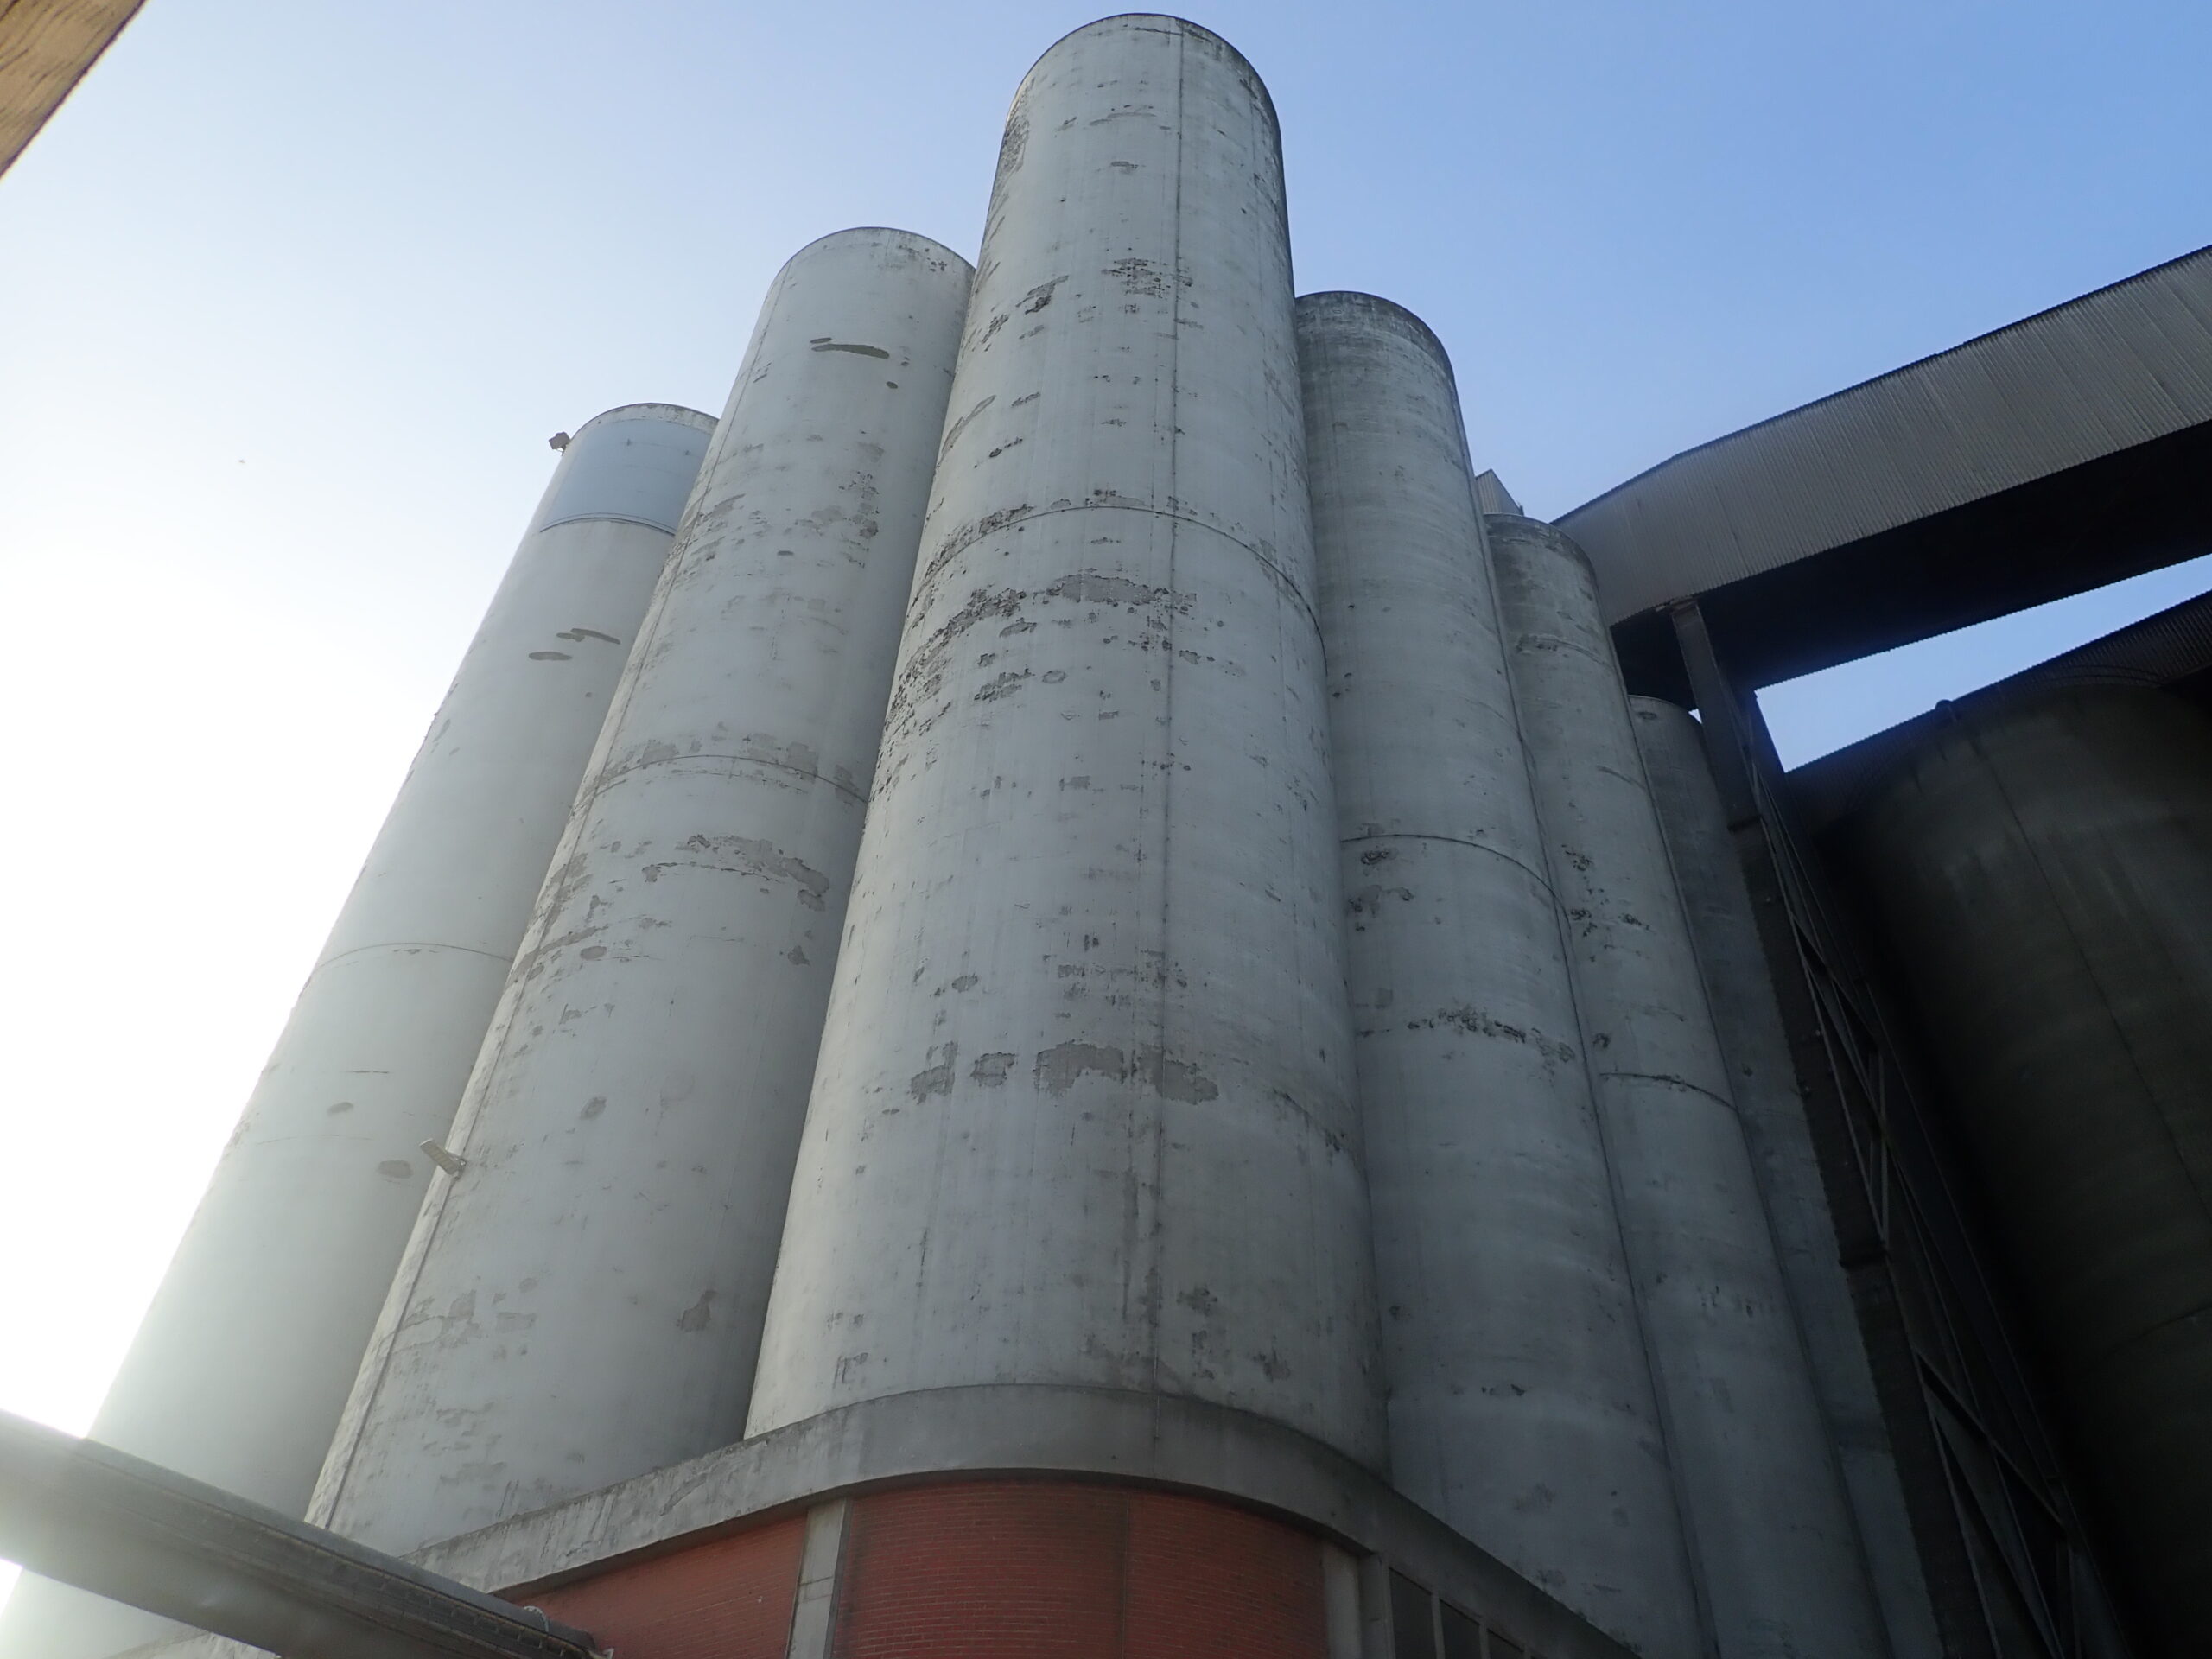
Drone and LiDAR images are converted into an accurate 3D model of your cooling tower, silo, tunnel or quay wall.

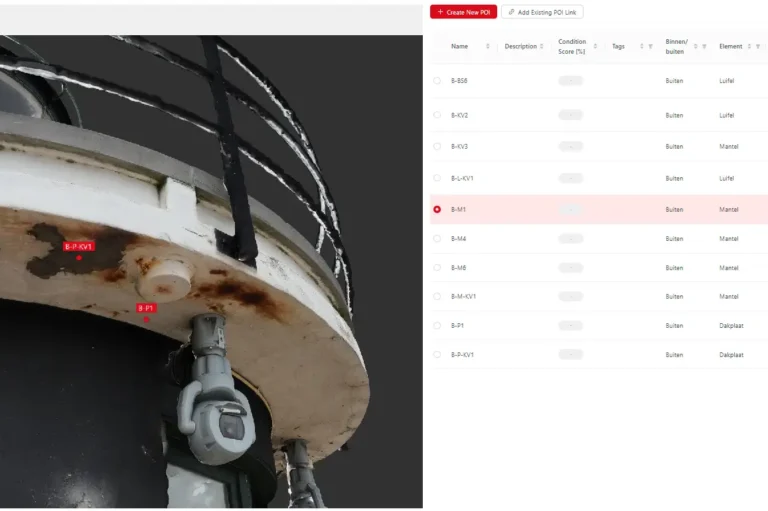
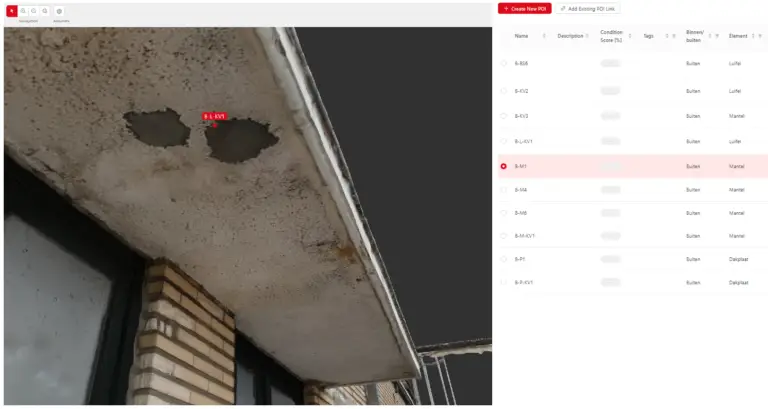
  • Spatial defect mapping: defects, test locations and core positions are mapped directly onto the geometry.

  • Temporal tracking: compare 3D models from different years to follow crack growth and spalling over time.

AI detection of surface damage

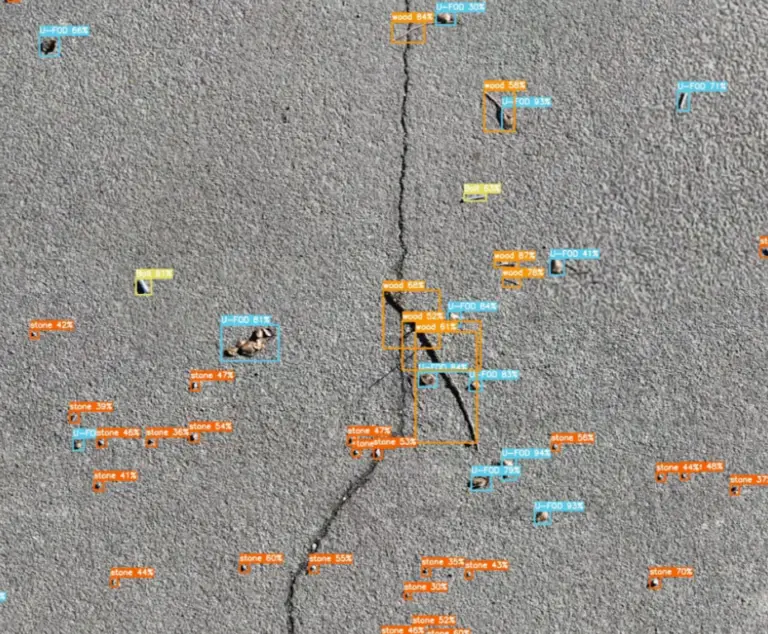
Step 3 · AI analysis

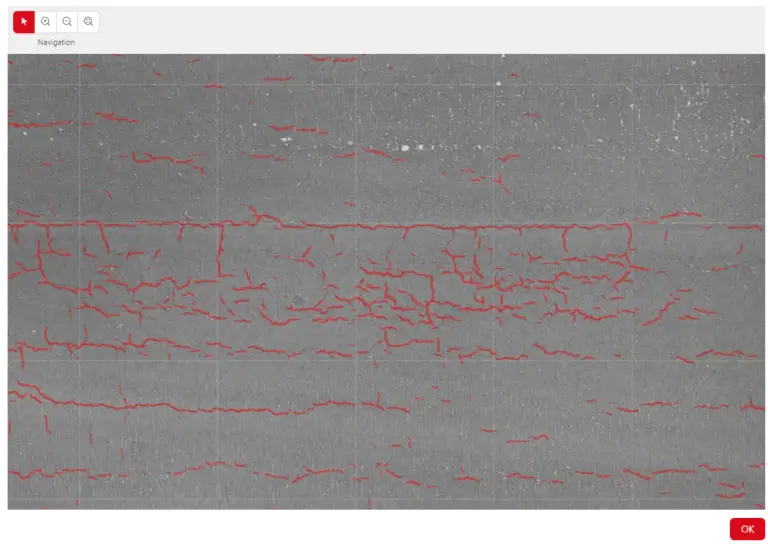
The platform identifies, measures and classifies cracks, spalling and efflorescence in large photo sets.

  • Linked to lab results: visual damage is connected to the material test results at the same location.

  • Automated reporting: reports are generated automatically, with up to 70% less reporting time.

Concrete service life prediction: depassivation risk modelling for reinforced concrete elements in DIMCOST

Remaining service life and maintenance planning

Step 4 · Prediction and planning

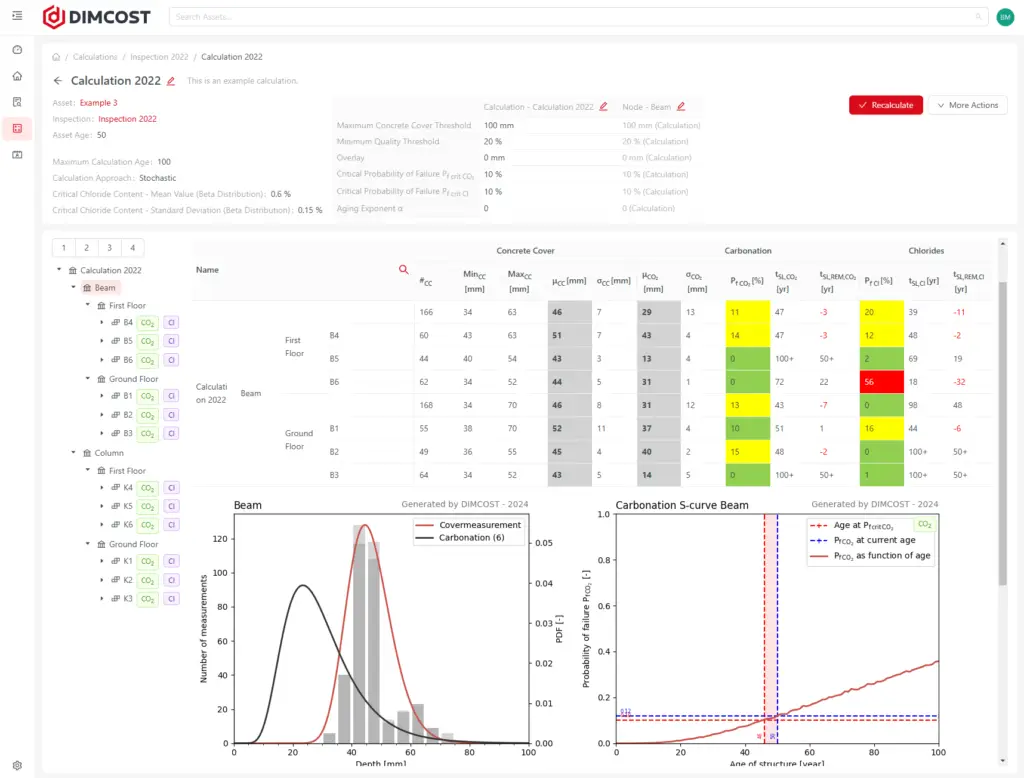
DIMCOST models carbonation, chloride ingress and the onset of reinforcement corrosion based on your own measurements.

  • Probabilistic, per zone: you don’t get a single number, but the probability of corrosion over time for every zone.

  • Clear priorities: see which parts need attention now and which will remain safe for years.

  • Scenario comparison: compare a “do nothing” scenario with targeted repair options and their long-term budget impact.

What you gain

  • Targeted repairs

    Invest in the zones that need it, instead of renovating the full structure.

  • Well-founded CapEx/OpEx planning

    Evidence you can present to management, insurers or authorities.

  • A single source of truth

    One platform for owners, inspectors and consultants.

  • Faster reporting

    Automated reports and a complete history per asset.

Who is it for?

  • Asset owners and managers

    Of cooling towers, silos, tunnels, bridges, quay walls and industrial facilities.

  • Engineering and consultancy firms

    That want to support durability assessments with validated models.

  • Inspection and drone teams

    That want to turn raw field data into usable deliverables quickly.

Use cases

Used on complex concrete structures

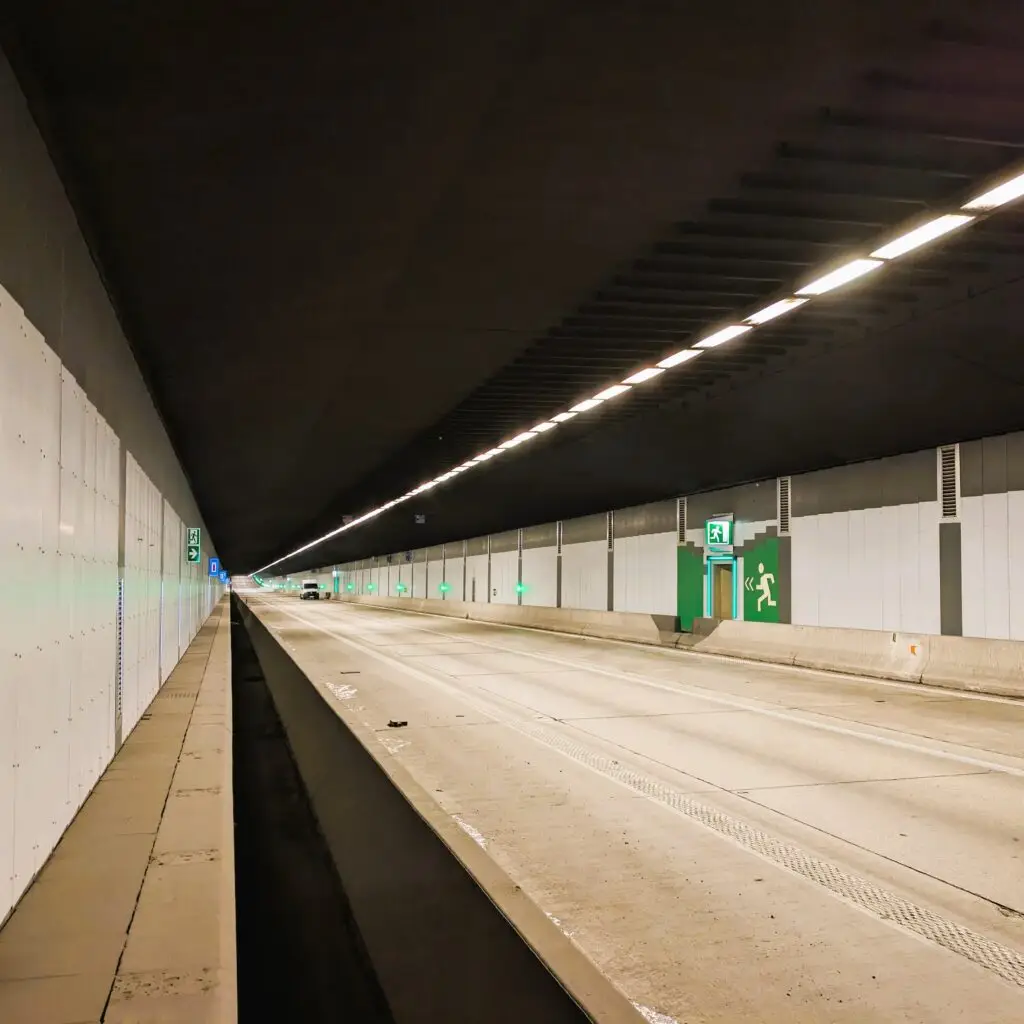
From cooling towers to immersed tunnels: see how DIMCOST predicts the remaining service life of real structures.

View all use cases →
FAQ

Frequently asked questions

How long does concrete last?

It depends on concrete cover, concrete quality and the environment. A structure in an aggressive environment (seawater, de-icing salts, brackish cooling water) can show corrosion damage after a few decades, while well-designed structures reach 100 years or more. DIMCOST calculates this for your structure based on real measurement data.

What is the difference between a concrete inspection and a service life prediction?

An inspection records what the structure looks like today. A concrete service life prediction calculates how fast degradation will spread and when an intervention will be needed. DIMCOST combines both.

Which degradation mechanisms are modelled?

Carbonation, chloride ingress and the resulting onset of reinforcement corrosion.

What data do I need?

Existing inspection reports and measurements of concrete cover, carbonation depth and chloride profiles are a good starting point. If data is missing, we show you which additional measurements add the most value.

Can I import data from other parties?

Yes. You can import reports, lab results and images that you or other parties have already collected.

Book a demo

See your own structure in the platform, in just 30 minutes

Tell us what type of structure it is and which inspection data you already have. We’ll show you what a concrete service life prediction for your structure looks like in the platform.